COVID-19 Cases: Data and Graphs of India and the World
Covid-19: Cases in India with High Rate of Infection
The graph above shows the progress of the disease once the number of infected people crossed the 100-mark. Since the epidemic has traveled to the different states at different times, the trajectories of the number of infected differ, but it seems to follow the same pattern once you adjust the graph to show the days adjusted to when Maharashtra reached 100 infections.
Maharashtra and Kerala were the two states that had their first 100 cases March 25. The doubling of cases in Maharashtra is between 4 and 5 days, while Kerala has seen a significant decline in the rate of doubling of cases.
Covid-19 Deaths in India in Highly Infected State
The graph above shows the progress of the disease once the number of deaths crossed the 10-mark. Since the epidemic has traveled to the different states at different times, the trajectories of the number of deaths differ, but it seems to follow the same pattern once you adjust the graph to show the days adjusted to when Maharashtra reached 10 days.
Maharashtra reported the 10th death on March 31, 2020.
Total Cases in Highly Infected States and Cities in Percentages
The total number of cases in highly infected states is concentrated in a few cities. In the case of Delhi, cases have been reported from across the city. In Madhya Pradesh the city reporting infection the most is Indore. And, in Maharashtra, about 63.7% of the cases have been reported from Mumbai itself in the past 24 hours.
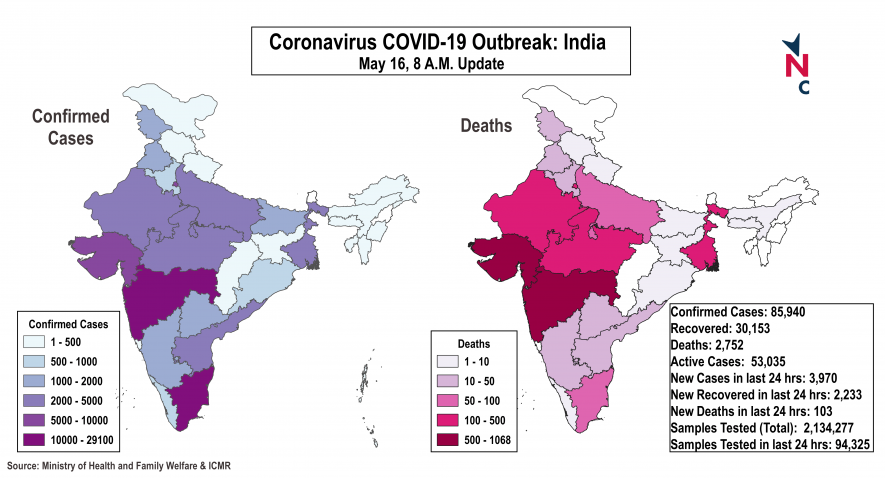
COVID-19 Cases in India as on May 16, 8 AM
| State/UT | Total Confirmed Cases | Cured/Discharged/Migrated | Deaths | Active Cases |
|---|---|---|---|---|
| A & N Islands | 33 | 33 | 0 | 0 |
| Andhra Pradesh | 2,307 | 1,252 | 48 | 1,007 |
| Arunachal Pradesh | 1 | 1 | 0 | 0 |
| Assam | 90 | 41 | 2 | 47 |
| Bihar | 1,018 | 438 | 7 | 573 |
| Chandigarh | 191 | 37 | 3 | 151 |
| Chhattisgarh | 66 | 56 | 0 | 10 |
| Dadar Nagar Haveli | 1 | 0 | 0 | 1 |
| Delhi | 8,895 | 3,518 | 123 | 5,254 |
| Goa | 15 | 7 | 0 | 8 |
| Gujarat | 9,931 | 4,035 | 606 | 5,290 |
| Haryana | 818 | 439 | 11 | 368 |
| Himachal Pradesh | 76 | 39 | 3 | 34 |
| Jammu and Kashmir | 1,013 | 513 | 11 | 489 |
| Jharkhand | 203 | 87 | 3 | 113 |
| Karnataka | 1,056 | 480 | 36 | 540 |
| Kerala | 576 | 492 | 4 | 80 |
| Ladakh | 43 | 22 | 0 | 21 |
| Madhya Pradesh | 4,595 | 2,283 | 239 | 2,073 |
| Maharashtra | 29,100 | 6,564 | 1,068 | 21,468 |
| Manipur | 3 | 2 | 0 | 1 |
| Meghalaya | 13 | 11 | 1 | 1 |
| Mizoram | 1 | 1 | 0 | 0 |
| Odisha | 672 | 166 | 3 | 503 |
| Puducherry | 13 | 9 | 1 | 3 |
| Punjab | 1,935 | 305 | 32 | 1,598 |
| Rajasthan | 4,727 | 2,677 | 125 | 1,925 |
| Tamil Nadu | 10,108 | 2,599 | 71 | 7,438 |
| Telengana | 1,454 | 959 | 34 | 461 |
| Tripura | 156 | 42 | 0 | 114 |
| Uttarakhand | 82 | 51 | 1 | 30 |
| Uttar Pradesh | 4,057 | 2,165 | 95 | 1,797 |
| West Bengal | 2,461 | 829 | 225 | 1,407 |
| Cases being reassigned to states | 230 | 230 | ||
| India Total | 85,940 | 30,153 | 2,752 | 53,035 |
| Past 24 hrs Status | 3,970 | 2,233 | 103 |
Source: https://www.mohfw.gov.in/
| Testing Status: ICMR | |
|---|---|
| 16-May | 2134277 |
| 15-May | 2039952 |
| 14-May | 1947041 |
| 13-May | 1854250 |
| 12-May | 1759579 |
| 11-May | 1673688 |
| 10-May | 1609037 |
| 9-May | 1523213 |
| 8-May | 1437788 |
| 7-May | 1357413 |
| 6-May | 1276781 |
| Past 24 hrs Testing Status | 94325 |
| Source: https://www.icmr.gov.in/ |
Confirmed Cases of Covid-19, Recovered Cases and Deaths
Cases in Major Countries
The graph above shows the progress of the disease once the number of infected people crosses the 100 mark. Since the epidemic has traveled to these countries at different times, the trajectories of the number of infected differ, but it seems to follow the same pattern once you adjust the graph to show the days adjusted to when Italy reached 100 infections. It is clear that all countries tend to double the number of infected between 3 to 5 days. As the graph shows, India is about three weeks behind the US and 20 days behind Italy.
Italy reached 100 infected cases on February 23, 2020.
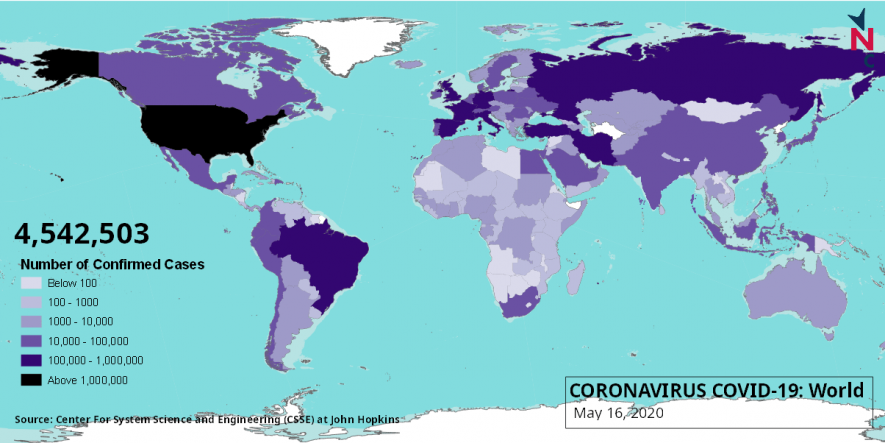
Total Confirmed Cases
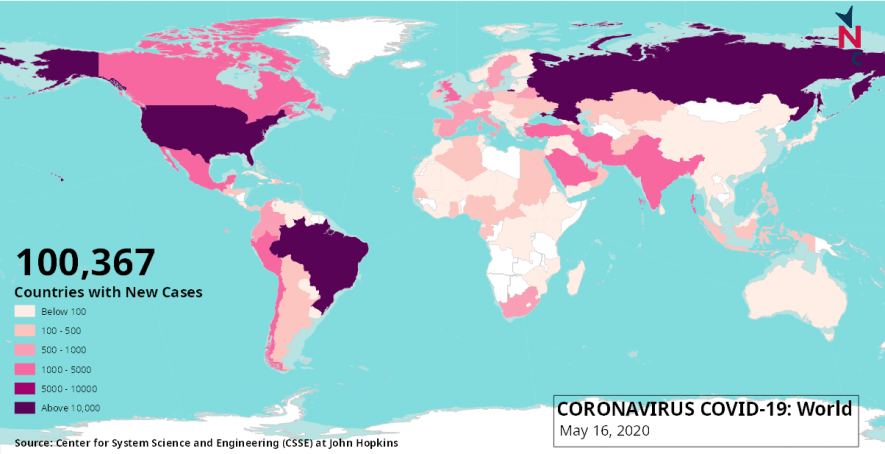
New Cases Worldwide:
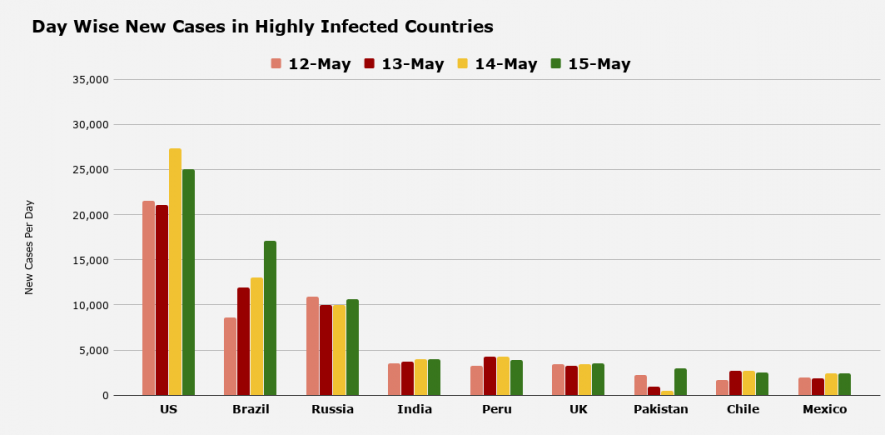
Deaths in Countries with High Rate of Infection
Total Deaths Worldwide:
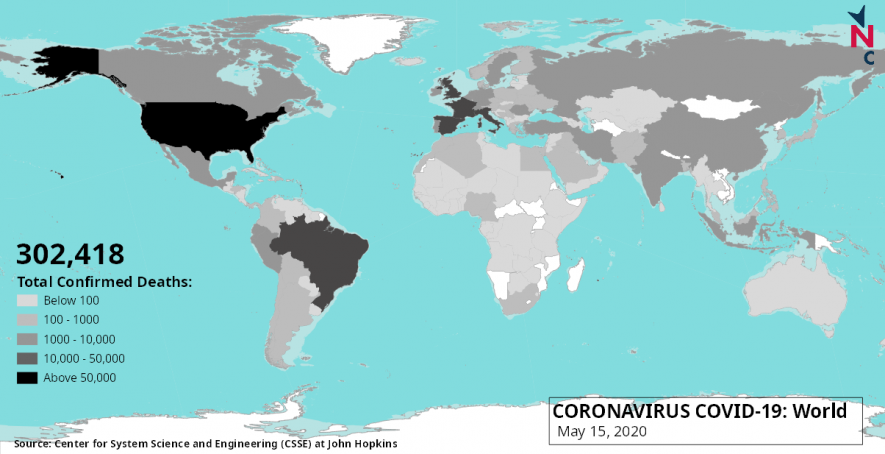
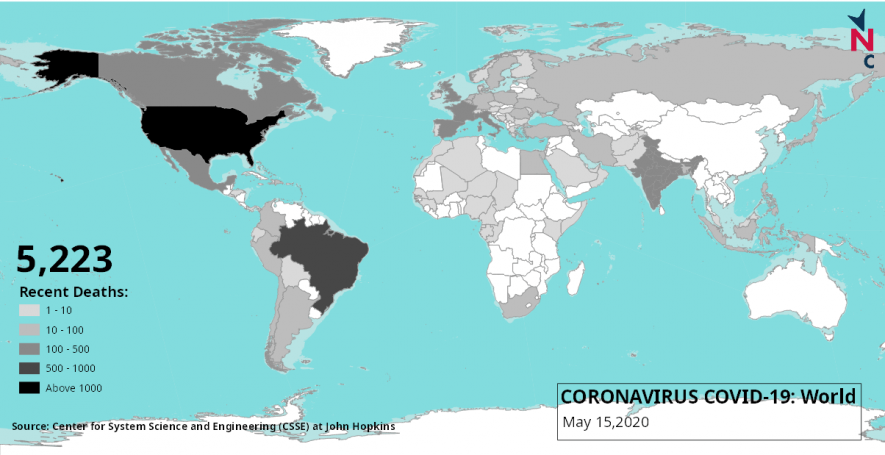
New Deaths Worldwide:
Covid-19 Status in Highly Infected Countries (May 16)
| Country | Total Confirmed Cases | Total Recovered | Total Deaths | Active Cases |
|---|---|---|---|---|
| US | 14,42,824 | 2,50,747 | 87,530 | 11,04,547 |
| Russia | 2,62,843 | 58,226 | 2,418 | 2,02,199 |
| United Kingdom | 2,38,004 | 1,047 | 34,078 | 2,02,879 |
| Spain | 2,30,183 | 1,44,783 | 27,459 | 57,941 |
| Italy | 2,23,885 | 1,20,205 | 31,610 | 72,070 |
| Brazil | 2,20,291 | 84,970 | 14,962 | 1,20,359 |
| France | 1,79,630 | 60,562 | 27,532 | 91,536 |
| Germany | 1,75,233 | 1,51,597 | 7,897 | 15,739 |
| Turkey | 1,46,457 | 1,06,133 | 4,055 | 36,269 |
| Iran | 1,16,635 | 91,836 | 6,902 | 17,897 |
| India | 85,940 | 30,153 | 2,752 | 53,035 |
| Peru | 84,495 | 27,147 | 2,392 | 54,956 |
| China | 84,038 | 79,281 | 4,637 | 120 |
| Canada | 75,959 | 36,908 | 5,679 | 33,372 |
| Belgium | 54,644 | 14,301 | 8,959 | 31,384 |
| Saudi Arabia | 49,176 | 21,869 | 292 | 27,015 |
| Mexico | 45,032 | 30,451 | 4,767 | 9,814 |
| Netherlands | 43,880 | 159 | 5,662 | 38,059 |
| Others | 7,83,354 | 3,26,587 | 28,082 | 4,28,685 |
| World Total | 45,42,503 | 16,36,962 | 3,07,665 | 25,97,876 |
Covid19 Status in Past 24 Hours in Highly Infected Countries (May 16)
| Country | New Cases | New Recovered cases | New Deaths |
|---|---|---|---|
| US | 25,050 | 4,333 | 1,632 |
| Brazil | 17,126 | 5,491 | 963 |
| Russia | 10,598 | 4,696 | 113 |
| India | 3,970 | 2,233 | 103 |
| Peru | 3,891 | 1,996 | 125 |
| United Kingdom | 3,564 | 4 | 385 |
| Pakistan | 3,011 | 1,185 | 64 |
| Chile | 2,502 | 959 | 26 |
| Mexico | 2,437 | 1,976 | 290 |
| Saudi Arabia | 2,307 | 2,818 | 9 |
| Iran | 2,102 | 1,297 | 48 |
| Turkey | 1,708 | 2,103 | 48 |
| Bangladesh | 1,202 | 521 | 15 |
| Canada | 1,178 | 804 | 87 |
| Qatar | 1,153 | 190 | 0 |
| Ecuador | 965 | 0 | 256 |
| Belarus | 958 | 639 | 5 |
| Kuwait | 885 | 189 | 8 |
| Others | 15,760 | 17,684 | 1,070 |
| World Total | 1,00,367 | 49,118 | 5,247 |
Get the latest reports & analysis with people's perspective on Protests, movements & deep analytical videos, discussions of the current affairs in your Telegram app. Subscribe to NewsClick's Telegram channel & get Real-Time updates on stories, as they get published on our website.