Climate War: Who is the Culprit?
Fossil fuel has always been an indispensable part of the process of industrialisation. This anthropogenic intervention in the earth's natural carbon cycle leads to increased carbon concentration in the atmosphere. Inter-governmental Panel has published various reports on Climate Change (IPCC), environmental research institutes and independent researchers predicting the fate of humankind if adequate efforts are not made to keep the temperature fluctuation under check.
The Stern Report, 2006 raised the red flag regarding the contemporary measures taken throughout the world. It advocated for more concentrated efforts to strategise the early peak (as early as 2050, rather than the decided 2070) of Green House Gas concentrations to minimise the harmful effects of climate change. Nicholas Stern also pointed out that the economic loss due to inaction towards climate change could be equivalent to losing more than 5% of the global GDP annually and indefinitely. In comparison, the cost of reducing GHG levels to minimise the harmful effects of climate change can be around 1% of global GDP annually.
This article will shed light on the history of international negotiations on climate change and then analyse the trends of GHG emissions in the last three decades of rapid climate change. We will examine the world bank database to track the Carbon Dioxide emissions for various regions and compare it with a counterfactual ideal created for an equitable world.
HISTORY OF INTERNATIONAL NEGOTIATIONS ON CLIMATE CHANGE
The first global conference on environmental degradation was held on June 5, 1972 in Stockholm, Sweden. This day marked the beginning of a significant era for international efforts on the deteriorating environment, and hence it is celebrated as the World environment day after the Stockholm conference. To assess the Climate Change threat, an Inter-Governmental Panel on Climate Change (IPCC) was convened in 1988. It was identified that climate change could prove catastrophic if the business-as-usual continued. At the Earth Summit (Rio, 1992) United Nations Framework Convention on Climate Change (UNFCCC) was signed by 196 countries. The objective of stabilising the greenhouse gas (GHG) at a level enough to avoid anthropogenic disasters was set (though legally non-binding).
For the first time, the world was divided into three groups, namely Annexe-1, Annexe-2 and non-Annexe-1 parties, to allocate the common but differentiated responsibilities. Annexe-1 included OECD and Economies in transition (EIT) countries. Annexe-2 countries had OECD countries but not the EIT from Annexe-1; they were supposed to provide financial help to non-Annexe-1 (developing) countries to reduce emissions and adapt to climate change's adverse effects. The development needs (poverty reduction, ensuring food security etc.) of the non-Annexe-1 countries were recognised, and mechanisms were made to allow smooth flow of funds from the Annexe-2 countries to the developing countries.
The Berlin conference of 1995 mandated a conference of parties (COP) to be held every year to discuss and improve strategies to stabilise GHG emissions at the required level. Several fundamental issues included; deciding on the acceptable limits of GHG levels or temperature fluctuation, distribution of the total emissions among the countries, and ensuring that such distributed rights were implemented rightly (such as no country emits more than the allocated rights). These issues are yet to be solved entirely. The Kyoto protocol (COP-3) of 1997 had set emission targets for the developed countries, legally binding under international law. At present, there are 191 signatory countries to this protocol and USA, the largest CO2 emitter at that time, withdrew in 2001. The 21st COP was held in Paris in 2015 to control the temperature rise below 1.5 degrees Celsius relative to the pre-industrial level. Various developing and developed countries declared their INDCs (Intended Nationally Determined Contributions) to tackle and curb the GHG emissions (around 187 countries announced their plans, including India). The latest COP-26 was held from October 31 to November 21, 2021 in Glasgow, UK, where several countries revised their INDCs, including India.
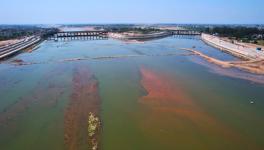
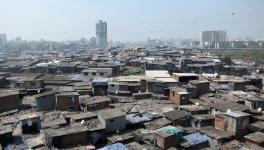
The global temperature has already risen 1.2 degrees Celsius warmer than the pre-industrial level, and the Paris Agreement target seems like a distant dream. If business continues, the effects could be catastrophic, more so for the island nations and other coastal regions, including frequent and intense storms, floods, increase in sea level etc. A report by Climate Central, a US-based news organisation, predicts that areas inhabited by 36 million Indians are at risk of severe flooding by 2050. Globally, 300 million people are expected to be chronically affected. This calls for urgent and more rigorous actions on global leaders.
WHAT DO THE NUMBERS SAY?
According to the Center for Climate and Energy Solutions, Carbon dioxide accounts for 76% of GHG emissions. We will analyse the CO2 emissions in the last three decades of global negotiations using the world bank data (accessed from here on January 21, 2022) for the years 1991-2018.
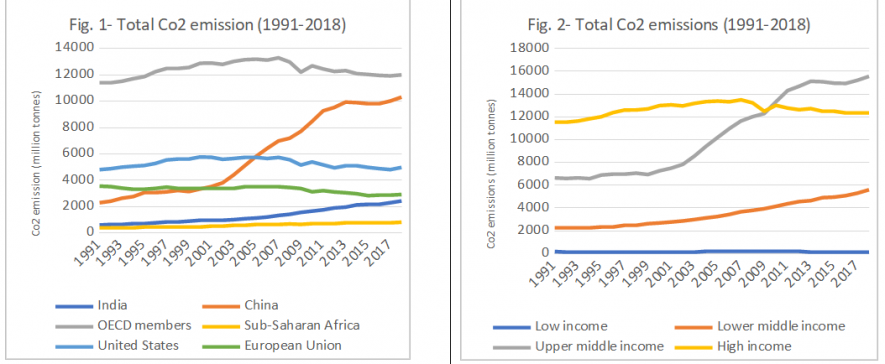
Source- Author's calculation based on data from <https://data.worldbank.org/topic/climate-change> accessed on January 21, 2022
The above figures plot total carbon emissions by the above countries, regions and groups of countries. Sub-Saharan Africa, consisting of 46 out of 54 African countries housing more than a billion people, can be seen as emitting the least Carbon Dioxide among its group in Fig.1. The USA, inhabiting less than a third of the Sub-Saharan African population, emitted at least six times CO2, even emitting more than 12 times in some years. China's total emissions can be seen rising, overtaking the USA as emitting most CO2 into the environment somewhere in 2004-05. If we compare the group of countries based on their incomes (as classified by the world bank based on per capita GNI), the low-income countries emitted the lowest Carbon Dioxide. In contrast, the other group of countries either increased their emissions or fluctuated at higher levels in the period of study.
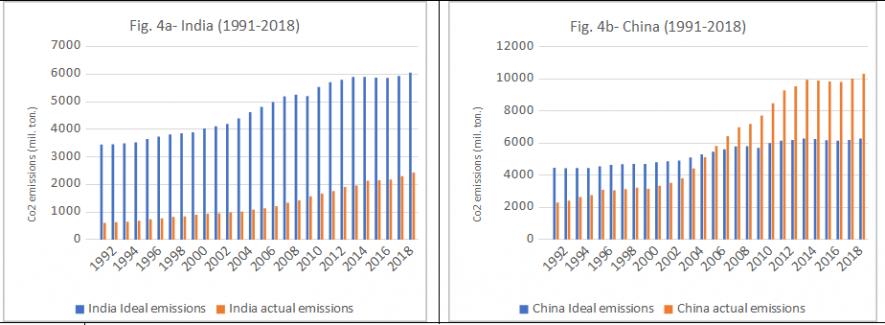
To discuss the idea of Carbon Dioxide emissions in an ideal scenario, the best method is; wherein total global CO2 released in a year is divided by the population of that year, to get the world per capita CO2 emissions and multiplying this number with the population of a country/region to get their ideal share of CO2 emission in that year. This method was first employed by Prof Sudhakar Yedla (IGIDR, Mumbai) and Sandhya Garg (then PhD student at IGIDR) in 2014 to assess the equity in carbon emission by various countries. The results from my analysis are presented below in Figures 3 and 4.
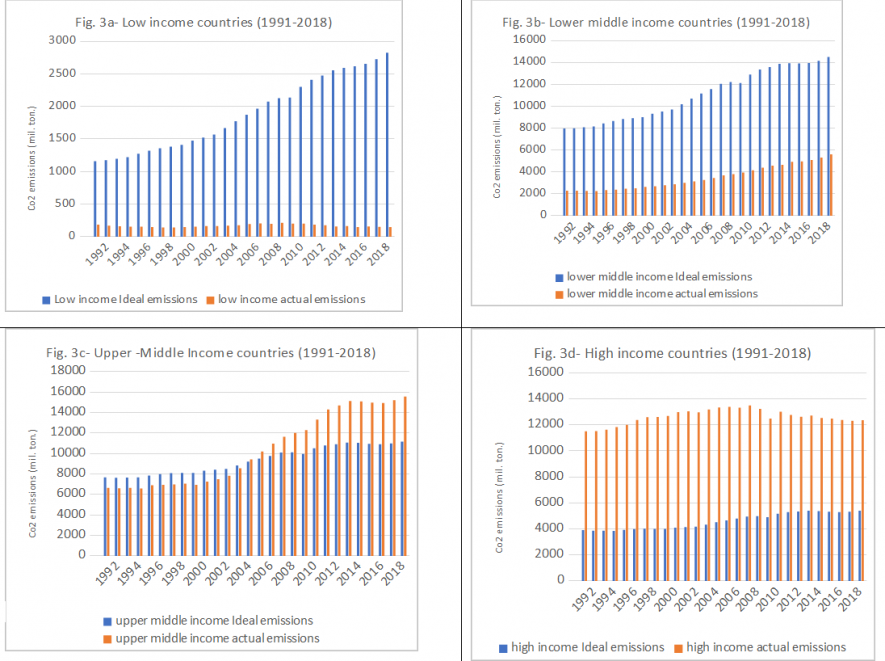
Source- Author's calculation based on data from <https://data.worldbank.org/topic/climate-change> accessed on January 21, 2022
The figures presented above can be interpreted easily. It can be seen that the low-income countries have emitted 5-16% of their ideal emissions (based on multiplying the low-income countries population with the world per capita emissions each year), underutilising their carbon space. On the other hand, the high-income countries overused their carbon space by 229-317% (1991-2018). The lower-middle-income countries also remained under utiliser of carbon space. In contrast, the upper-middle-income countries changed from under to over utiliser of their space in the period under observation.
Source- Author's calculation based on data from <https://data.worldbank.org/topic/climate-change> accessed on January 21, 2022
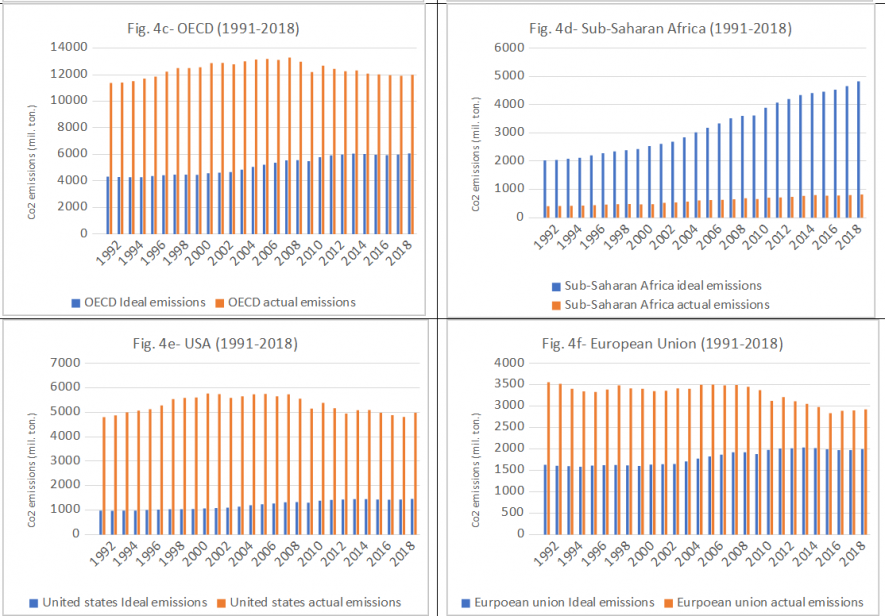
Figure-4 presents the comparison in ideal and actual carbon emissions in advanced countries (USA, EU, OECD), developing countries (India), upper-middle-income (China) and the low-income countries of Sub-Saharan Africa. The results can be easily interpreted from the figures above. The advanced countries have been over-emitting Carbon Dioxide than their ideal emission levels. India and Sub-Saharan African countries can be seen as under-emitting, and China only turned from under to over-emitter in the study period.
DISPROPORTIONATE ROLE OF INDUSTRIALISED COUNTRIES
Various GHGs have different radiative efficiency (to trap heat) and lifespan. The average lifespan of a single molecule of Carbon Dioxide is around 200-250 years making it last other GHGs such as methane with 10-15 years of lifespan. Therefore, in the case of CO2 (76% of total GHGs), historical emissions matter and need to be analysed to fix the responsibility. The following table shows the total emissions by the whole world and the share of certain countries, regions and groups of countries.
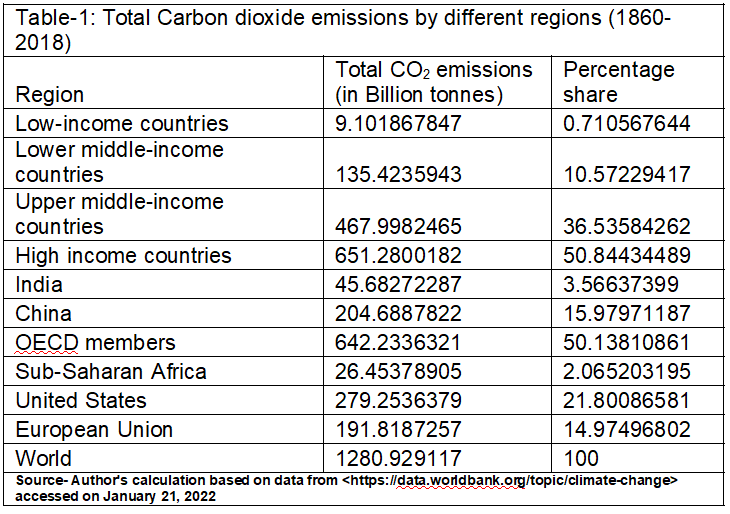
With 4.29% of the world's population (based on 2018 population data), the USA is solely responsible for around 21.8% of cumulative Carbon Dioxide emissions in the whole world from 1860 to 2018. The 46 Sub-Saharan countries have emitted just 2% of the total emissions in this period. In contrast, the 38 countries of OECD are responsible for more than half of the Carbon Dioxide emissions in the period under study in Table-1.
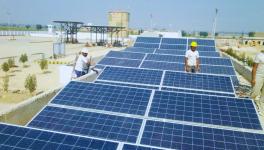
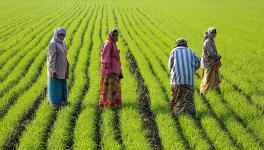
The sixth assessment report of IPCC, Climate Change 2021: The Physical Science Basis, says that the world has only a budget of 400 GtCO2 left to keep the temperatures below the targeted 1.5 degrees Celsius to keep the catastrophic effects of climate change at the bay. The now developed world has uncontrollably emitted various GHGs since the industrial revolution for wealth creation and shrunk the available carbon space for the low-income developing countries. The low-income and lower-middle-income developing countries are still dealing with the basic problems of poverty, starvation, food insecurity, etc. They need to grow to fight these developmental challenges. A development space (freedom to emit Carbon Dioxide and other GHGs) is necessary for these countries to grow and achieve their developmental goals.
The developing world has produced much less Carbon Dioxide than the developed ones. An analysis similar to the one done above can be easily used to identify and hold the historical and present over-users of carbon space accountable for the adversities faced by less emitting countries and to pay for overstepping into the carbon space of other countries. In other words, a carbon debt is owed to the now developing world. There should be no doubt about the disproportionate role of advanced economies such as the USA and other high-income OECD member countries in pushing the earth over to the cliff named climate change.
Ajay Saharan is a PhD scholar at IGIDR, Mumbai. His views are personal.
Get the latest reports & analysis with people's perspective on Protests, movements & deep analytical videos, discussions of the current affairs in your Telegram app. Subscribe to NewsClick's Telegram channel & get Real-Time updates on stories, as they get published on our website.