Air Quality Crisis: NCAP and Non-NCAP Cities Showing Similar Trends in PM 2.5 Levels
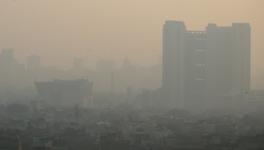
Representational image. | Image courtesy: Flickr
Patna: Contrary to the government claims of overall improvement in air quality, a large number of cities under the National Clean Air Programme (NCAP) and non-NCAP cities need a substantial reduction in PM 2.5 levels to meet the national ambient air quality standards in all climatic zones, according to the latest countrywide air quality analysis by the Centre for Science and Environment (CSE), a New Delhi-based non-profit organisation.
The new air quality analysis, released on the eve of International Blue Sky Day on Tuesday, pointed out that NCAP and non-NCAP cities are showing similar trends in PM 2.5 levels. The analysis stressed the need to adopt regional air quality planning for all cities and regions to improve overall air quality.
As per the air quality analysis, the NCAP has set a national level target of a 20-30% reduction in PM2.5 and PM10 concentrations by 2024 from the 2017 base year. But the latest performance assessment of NCAP cities by the Central Pollution Control Board (CPCB) for disbursement of performance-linked funds has considered only PM10 data that is largely coarse dust particles. As the monitoring of PM2.5 -- the tinier particles that are much more harmful -- is limited, a uniform assessment of cities based on PM2.5 reduction has not been considered for performance assessment.
The NCAP covers 132 cities -- 82 of these have been funded by the Programme, while 50 cities have received funds from the 15th Finance Commission; Rs 6,425 crore has been released till 2021-22 and Rs 2,299 crore has been earmarked for 2022-23. Cities are required to quantify improvement starting 2020-21 – this requires 15 per cent and more reduction in the annual average PM10 concentration and a concurrent increase in good air days to more than 200. Anything less than that will be considered low and reduce the funding.
CSE has carried out a national analysis of PM2.5 levels in cities for which data is available to understand the trend in both NCAP and non-NCAP cities, and the level of reduction needed in both groups of cities to meet the national clean air standards. This has also exposed the status of air quality monitoring in terms of manual and real-time monitoring, the extent of PM 10 and PM 2.5 monitoring in cities, and the challenges of data quality to construct and verify a longer-term air quality trend.
“While it is encouraging that funding of clean air action is linked to performance and the cities’ ability to demonstrate improvement in air quality, dependence on only manual monitoring of PM 10 evidently creates a bias in spending as it shifts focus more towards dust control and detracts attention from composite action on industry, vehicles, waste and solid fuel burning,” said Anumita Roychowdhury, executive director of research and advocacy at CSE.
“The expanding monitoring network of PM2.5 and key gases needs to be leveraged quickly to prioritise multi-pollutant action for more effective reduction of risk across all regions,” she adds.
The CSE’s study highlighted that only 43 NCAP cities have adequate PM 2.5 data for the period 2019-2021 – enough to create a reasonable trend for tracking progress. Nearly all cities have recorded a dip in PM 2.5 levels in 2020, followed by a subsequent increase in 2021. Therefore, a comparison between 2019 and 2021 shows that only 14 of the 43 cities have registered an overall 10% or more reduction in their PM 2.5 level in the two years.
There is adequate data to construct PM 2.5 trends for 43 NCAP cities and 46 non-NCAP cities for 2019-21. The non-NCAP cities can be treated as a control group to see how the NCAP funding has improved the air quality performance of cities. This is a simplistic non-standardised assessment and should not be treated as a conclusive assessment of NCAP, as air pollution has a regional character and many non-NCAP cities are located within the influence zone of NCAP cities which are generally much bigger with asymmetrical impact on the regional air quality baseline.
“As the system is becoming more performance-oriented and real-time air quality monitoring is expanding, it is necessary to develop and define robust protocols and methods for quality control of real-time data. It is crucial to ensure the adoption of standardised methods for data processing, analytics, and address data gaps and data completeness and construct a reliable trend to verify performance and compliance with the national air quality target,” says Avikal Somvanshi, programme manager, Urban Lab, CSE.
All six megacities registered a drop in their annual PM 2.5 levels in 2020, but pollution bounced back everywhere except in Chennai. In Delhi, pollution dropped by 13 per cent in 2020, but it rose by 13% in 2021, nullifying all the gains made by the national capital.
An equal number (39) of NCAP and non-NCAP cities did not meet the annual PM2.5 standard in 2021.
Ghaziabad is the most polluted NCAP city in the north, closely followed by Delhi, while Jodhpur is the most polluted NCAP city in the west, followed by Kota and Jaipur. Among the eastern states, Patna is the most polluted NCAP city, followed by Muzaffarpur and Durgapur. Hajipur and Siliguri are the most polluted non-NCAP cities. This is the only region where no city, NCAP or non-NCAP, meets the annual standard.
On average, cities of east India are the most polluted in the country, while cities in the south are the least polluted.
Roychowdhury said, “It is clear that the current practice of keeping the focus only on selected cities without considering the larger urban and regional landscape can limit the effectiveness of the NCAP programme and resource investment. The current mandate of developing state action plans has to be refined to ensure the regional approach is initiated for a wider impact.”
Get the latest reports & analysis with people's perspective on Protests, movements & deep analytical videos, discussions of the current affairs in your Telegram app. Subscribe to NewsClick's Telegram channel & get Real-Time updates on stories, as they get published on our website.