COVID-19: Increasing Numbers in Chhattisgarh Has Centre Worried
Chhattisgarh, apart from Uttar Pradesh, Jharkhand, and Odisha, has got the Centre worried. The decision thus is to send central teams to these states to help them with their fight to contain the rising numbers of COVID-19 cases. The reasons being cited are that these states “have seen a sudden surge and some of them are also reporting high mortality.”
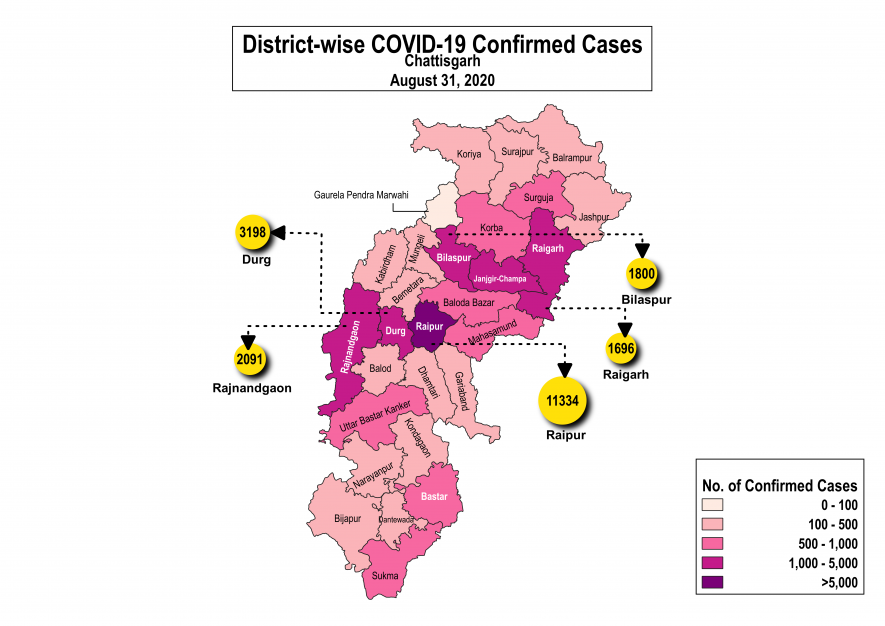
On August 24, Chhattisgarh reported 8,424 active cases, but on August 31 it had risen to 14,237. That’s an increase of nearly 9,000 confirmed cases in a week. The total confirmed cases stands at 31,503. The state reached its first 9,000 cases only on July 31, but August has witnessed a surge.
But, when we looked at Haryana’s battle against the novel coronavirus, “Haryana and Chhattisgarh have similar population figures.” But Haryana has conducted 11,50,126 tests so far while Chhattisgarh has conducted only 5,82,540. With that as the caveat, it should not come as a surprise that Raipur has reported the most number of cases, that is, more than 36 per cent of the cases are from the district.
The other two districts, Rajnandgaon with 6.6 per cent and Durg with 10.2 per cent of the total cases in the state, are prominent.
In the first week of June, the tests to new cases ratio was about 2.8 per cent. In the week July 07-13 it was about 3.2 per cent, but in the week August 25-31 it stood at 10.7 per cent — an indicator that the spread of the virus has been relentless, which has not been matched with a concomitant rise in testing infrastructure.
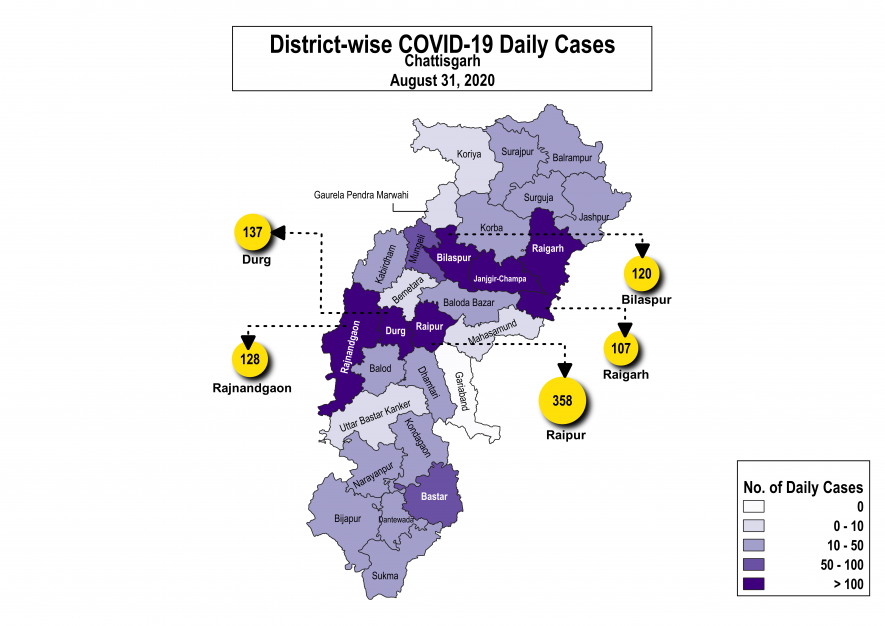
A look at the logarithmic chart below of some of the most affected districts, shows that the rise in cases in districts such as Raigarh and Durg, are as worrying as the situation in Raipur.
The charts assumes Baloda Bazaar as 0 since the district reached itsfirst 100 cases the first. The other districts’ start day is offset by the number of days the district took to reach its first 100 cases. The table below shows the number of days each district is behind Baloda Bazaar.
| Districts | Cases | First 100 Case Reported Date | Days Behind Bilalod Bazar |
| Raipur | 104 | 11-Jun | -4 |
| Durg | 108 | 23-Jun | -16 |
| Rajnandgaon | 100 | 19-Jun | -12 |
| Bilaspur | 105 | 8-Jun | -1 |
| Raigarh | 103 | 26-Jun | -19 |
| Janjgir Champa | 109 | 11-Jun | -4 |
| Baloda Bazar | 102 | 7-Jun | 0 |
| Bastar | 101 | 19-Jul | -42 |
The deaths, as to be expected, are most in Raipur district, given that it has the most number of confirmed cases in the state. More than 50 per cent of the fatalities are from Raipur district. Durg district with more than 12 per cent of the states fatalities, comes after Raipur. Durg also has a recovery rate of about 43 per cent, and more than 55 per cent active cases need some focus.
Rajnandgaon has, in contrast, a recovery rate of more than 70 per cent. The fatality rate is about 0.5 per cent, while it has about 29 per cent of the active cases, making it the third-most affected district, yet looking far better than Durg and Raipur.
With increased testing, hopefully soon, Chhattisgarh’s numbers might grow in September. At the current rate, the numbers don’t tell the truth, at least not the whole truth.
Get the latest reports & analysis with people's perspective on Protests, movements & deep analytical videos, discussions of the current affairs in your Telegram app. Subscribe to NewsClick's Telegram channel & get Real-Time updates on stories, as they get published on our website.