Highlights From the SIPRI Yearbook, 2017: Contextualizing International Arms Trade
The Stockholm International Peace Research Institute (SIPRI) has been providing vital data on arms trade, based on open sources, since 1966. The Swedish think tank produces data, analysis and recommendations based on its research from open sources, in its commitment towards ‘conflict, armaments, arms control and disarmament’.
Its latest annual yearbook provides data and analysis on arms trade for the five-year period between 2013 and 2017. Here we have some highlights of trends in international arms transfer.
India:
India was the biggest arms importer, according to SIPRI, for the 2013-17 period. Along with China, it was among the top five world importers even in the previous period of 2008-12. India’s imports make up for 12% of international arms imports. Russia is the primary exporter of arms to India, accounting for 62% of the total imports in this period, followed by USA supplying 15% and Israel supplying 11% of the entire arms transfer to India. Curiously, India is Israel’s primary arms importer, buying 49% of the arms Israel exports. In the 2012-16 SIPRI International Arms Transfer factsheet, this figure stood at 41%. And this comes on the heels of the cancelled Spike Missile deal and despite the various charges of corruption Israel’s arms industry faces.
USA’s entry as India’s second major arms supplier is also an important one, as SIPRI notes that imports from the US have increased by 557% between the periods of 2008-12 and 2013-17. This overall increase, between these two periods, with respect to Israel has been 285%. Pakistan’s arms imports, on the contrary, have decreased by 36% between 2008-12 and 2013-17. Tensions with Pakistan are the central rationale given for the increasing need of arms imports by India.
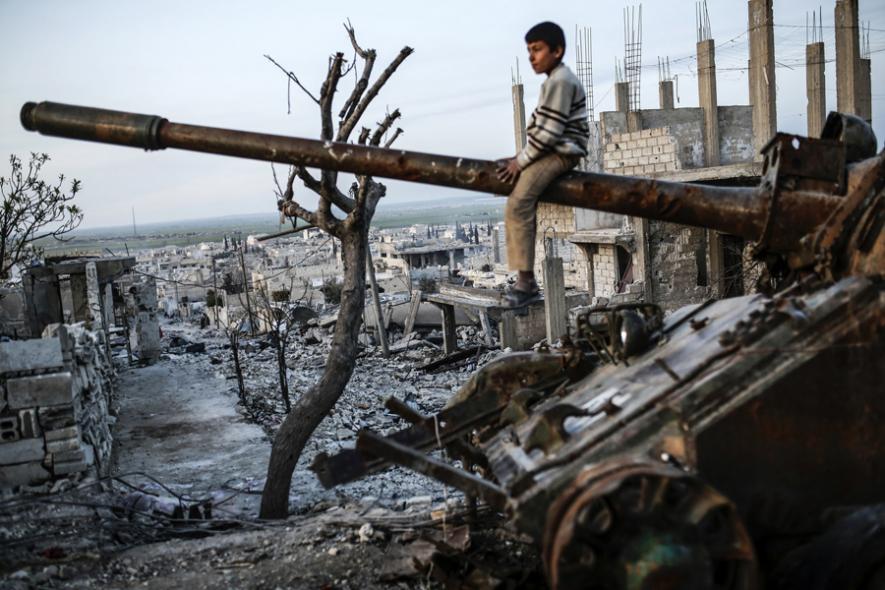
West Asia:
The period covered by the SIPRI factsheet (2013-17) was characterized mounting tensions in the region, particularly in Syria and Yemen, and the political alignments in the region precipitated by these. In this period, Saudi Arabia was the world’s second largest arms importer, with its imports increasing by 225% as compared to 2008-12. SIPRI analyses these imports in the background of large scale weapon deployment in Yemen by the Saudi-led international coalition. Analysing Saudi Arabia’s arms imports in the background of its weapons-deployment in Yemen, the report pointed out that 61% of its imports came from the US and 23% from the UK. Between the two same periods (2008-12 and 2013-17), Qatar’s imports also increased by 166%. Here too, the US was the top exporter, accounting for 67%, followed by Germany providing 20% of arms to Qatar. Combat aircrafts have been a crucial part of these imports for both Saudi Arabia and Qatar. These trends emerge in the context of mounting tensions between Qatar and Arab states, led by Saudi Arabia and UAE.
US and Europe:
Like in the previous period, USA remained the world’s top arms exporter in 2013-17, forging strategic and political partnerships through these transfers. Its share of total arms exports rose from 30% in 2008-12 to 34% in 2013-17. The gap between US and Russia - the second largest exporter - in terms of arms transfer grew from 17% to 58%. Saudi Arabia is the largest importer of USA’s arms, buying 18% of the total arms produced by the States. US arms exports to Saudi Arabia grew by 448% between 2008-12 and 2013-17. Increasing exports to India, as mentioned before, are seen by SIPRI as a part of offsetting China’s growing influence in Asia. Combat and transport aircrafts account for a major share of these exports.
France’s arms exports in this period grew by 27%, a major share of which went to the West Asia (42%), followed by Asia and Oceania which together bought 31%. While German arms exports decreased by 14% in this period, British arms exports increased by 37%.
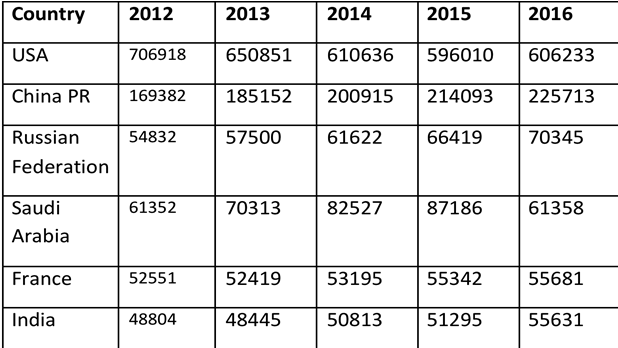
Finally, here is a table showing arms expenditure in US $ millions (based on 2015 constant) for the years 2012 to 2016. This includes countries whose arms expenditure is amongst the highest in the world.
Get the latest reports & analysis with people's perspective on Protests, movements & deep analytical videos, discussions of the current affairs in your Telegram app. Subscribe to NewsClick's Telegram channel & get Real-Time updates on stories, as they get published on our website.