Lessons from the National Family Health Survey
The Fourth National Family Health Survey (NFHS 4) was conducted in 2015 and preliminary results from a few states are now available. NFHS 4 follows similar countrywide surveys conducted in 1992 (NFHS 1), 1998 (NFHS 2), 2005 (NFHS 3). While the full report of the 2015 survey is still awaited, some preliminary inferences can be drawn from the reports now available. Till date preliminary data has been released for the following states and Union Territories: Andhra Pradesh, Andaman & Nicobar, Bihar, Goa, Haryana, Karnataka, Madhya Pradesh, Meghalaya, Pudduchery, Sikkim, Tamilnadu, Telengana, Tripura, Uttarakhand and West Bengal.
It is possible to comment on certain trends on progress made in the last couple of decades by comparing the data from 2015 in selected states with data from 1992 (NFHS 1) and 2005 (NFHS 3). Here we have selected a few parameters in only the big states, for which data is available, and compared this data with data from 1992 and 2005.
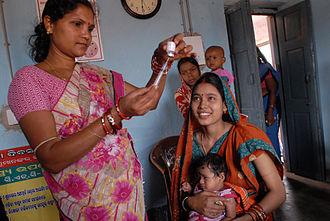
Image Courtesy: en.wikipedia.org
Trends in Child Mortality
The first set of data that we have are of the trends in Infant Mortality Rate (number of deaths of children below one year for every 1,000 live births) and Child Mortality Rate (number of deaths of children below five years for every 1,000 live births). Infant and child death rates are acknowledged as important indicators of overall development and not just of health services, as mortality among children is very sensitive to a variety of social and economic determinants. Table 1 provides the comparison.
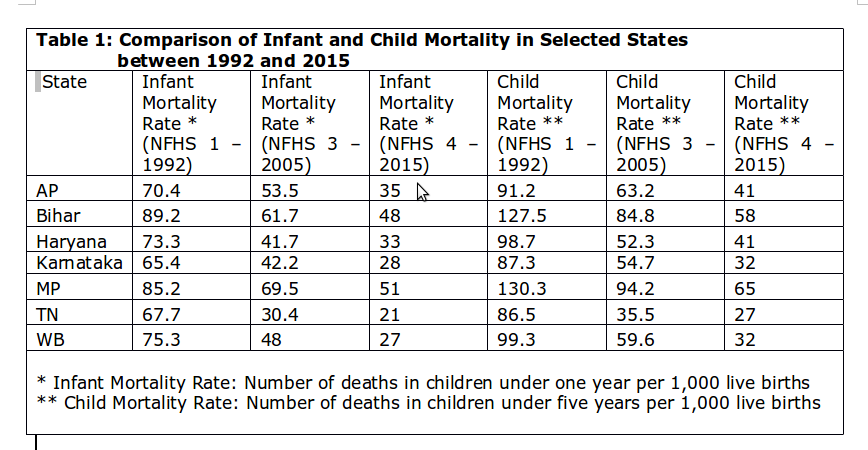
The Table indicates that there has been a gradual decline in mortality, which is generally good news. The comparison also indicates that some states have done much better than others (among the selected states). Tamilnadu and West Bengal (under Left Front rule in for most of the period under consideration) have done the best with a two-thirds reduction, and in the other states child mortality rates have been approximately halved. This correlates well with overall progress in social protection policies in Tamilnadu and West Bengal, as compared to the other states. It also belies extensive commentaries in the bourgeois press that West Bengal lagged behind in development during the tenure of the Left Front government.
It also needs to be noted that while there has been an overall decline in child mortality, all regions lag behind what has been achieved not just in high income countries, but also in a number of low and middle income countries even in South Asia. Overall Child Mortality Rate in Bangladesh stands at 38 in 2015, down from 109 in 1996, which is less than in AP, Bihar, Haryana, and MP. Nepal has done better, with the rate dropping from 102 in 1996 to 36 in 2015. Sri Lanka’s Child mortality Rate is much lower, at 10 in 2015. This flies in the face of the dominant discourse about the prosperity brought about by neoliberal reforms in India since 1991. Sri Lanka, Bangladesh and Nepal are countries that have been rocked by natural calamities and political upheavals and strife, yet have progressed better than India. Bangladesh and Nepal are also considerable less economically advanced, thus depicting the fallacy in the argument that economic growth automatically translates into social progress.
Worrying signals even as child sex ratio improves in some states
Table 2 provides data regarding trends in sex ratio at birth. Overall the signals are mixed. The earlier worse performing states (those with a ratio of below 900), like Haryana, Tamilandu, Bihar and AP have made significant progress. Unfortunately states with a relatively better ratio (over 900) like MP, Karnataka and West Bengal have shown declines in sex ratio. This is a particularly worrying trend and shows that the heinous practice of sex determination following by killing of the unborn girl child is spreading to new areas. One hopes that these trends will act as a reminder to policy makers in the present government who are inclined to weaken legislations against the practice of sex-determination and murder of the girl child.
|
Table 2: Sex Ratio at Birth in selected states 2005 and 2015 |
||
|
State |
Sex Ratio at Birth * 2005 (NFHS 3 ) |
Sex Ratio at Birth * 2015 (NFHS 4) |
|
AP |
876 |
914 |
|
Bihar |
893 |
934 |
|
Haryana |
762 |
836 |
|
Karnataka |
922 |
910 |
|
MP |
960 |
927 |
|
TN |
896 |
954 |
|
WB |
976 |
960 |
|
* Number of girls born per 1,000 boys over the past 5 years
|
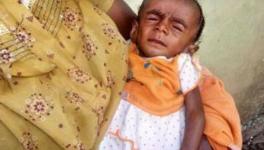
Too little progress in improving child nutrition
Table 3 provides a comparison of child malnourishment rates in the last decade – from 2005 to 2015. While a majority of states have shown significant decline, AP and Karnataka have shown almost no decline. Overall child malnutrition levels remain unacceptably high and India, which reported a countrywide child malnutrition rate of 29.4% in 2014, is doing worse than some of the poorest countries in the world such as Haiti (11.6% malnourished), Laos (26.5%), Malawi (16.7%), Mali (27.9%) and Myanmar (22.6%). The tragedy of poor nutrition that afflicts millions of children every year (the highest number of malnourished children in the world live in India) has been sought to be underplayed by planners, some of whom have tried to discredit such data on nationalistic lines. Prominent among them has been current Niti Ayog Vice Chair and BJP ideologue Arvind Panagariya, who attempts to argue that ‘Western’ methods of measurement are responsible for overestimating India’s child malnutrition levels. The reality is that a toxic combination of extreme poverty, gender discrimination and poor sanitation and poor access to safe drinking water is preventing a third of our children from living fulfilling lives. Early data from the NFHS survey once again proves that we are doing too little to save our children. Instead the present government, in the name of fiscal stability, is engaged in dismantling the existing programmes that target child nutrition.
|
Table 3: Percent of Malnourished Children in selected states -- 2005 and 2015 |
||
|
State |
Children under 5 who are Malnourished (%) * 2005 (NFHS 3) |
Children under 5 who are Malnourished (%) * 2015 (NFHS 4) |
|
AP |
32.5 |
31.9 |
|
Bihar |
55.9 |
43.9 |
|
Haryana |
39.6 |
29.4 |
|
Karnataka |
37.6 |
35.2 |
|
MP |
60.0 |
43.9 |
|
TN |
29.8 |
23.8 |
|
WB |
38.7 |
31.5 |
|
* Children under 5 whose weight is less than 2 standard deviations of normal for age
|
Immunization coverage points to deficiencies in public system
Table 4 provides comparative data on immunization coverage, an useful indicator of the state of public health services. Clearly the news is not good. While some states have shown improvement, barring West Bengal with 84.4% coverage (testimony to the Left Front’s endeavour to expand public health services), all other states show a coverage for complete immunization of less than 70%. Worryingly the otherwise good performing state of Tamilnadu has reported a drop in coverage from 80.9% in 2005 to 69.7% in 2015. The other state which has reported a decline in coverage is Haryana. This data should act as a sobering influence on the urgency being shown to include new vaccines in the national programme, in the face of data that even the present vaccines in the national programme are not reaching a significant number of children. The data also points to the floundering state of public services, which suffered due to restricted resources during the tenure of the UPA government, and which is being further starved of even the meager resources allocated earlier, by the current government.
|
Table 4: Percent of children fully immunized – 2005 and 2015 |
||
|
State |
Fully Immunised * 2005 (NHFS 3) |
Fully Immunised * 2015 (NFHS 4) |
|
AP |
46.0 |
65.3 |
|
Bihar |
32.8 |
61.7 |
|
Haryana |
65.3 |
62.2 |
|
Karnataka |
55.0 |
62.6 |
|
MP |
40.3 |
53.6 |
|
TN |
80.9 |
69.7 |
|
WB |
64.3 |
84.4 |
|
* Children under 5 years who received all the doses in the routine immunization programme
|
Rise in caesarian deliveries evidence of unethical practices in private facilities
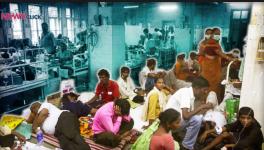
Table 5 provides data regarding institutional deliveries, i.e. deliveries taking place in medical facilities rather than at home, the type of facilities in which deliveries are being conducted (public or private) and on the incidence of caesarian deliveries. A push for institutional deliveries has been a major focus of the National Rural Health Mission, instituted by the UPA government in 2005. Clearly the strategy is working and there has been a secular and significant scale up of institutional deliveries. The data also shows how a very high percent of institutional deliveries are taking place in private facilities – over 30% in all states studied and over 60% in AP. This is a consequence of the drive to outsource healthcare to the private sector even when public funds are used and the practice is leading to a number of negative consequences. A clear example of this is evident from the data on the incidence of caesarian sections. All states report a much higher incidence of caesarians in private facilities – ranging from 25.3% in Haryana to 70.9% in West Bengal.
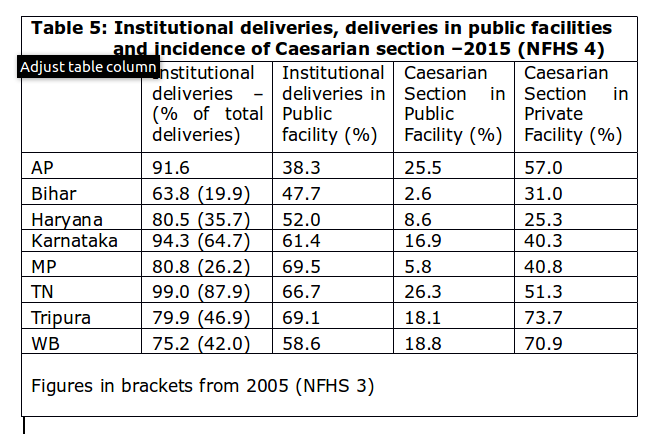
The World Health Organization (WHO) reports: “Since 1985, the international healthcare community has considered the ideal rate for caesarean sections to be between 10-15%. Since then, caesarean sections have become increasingly common in both developed and developing countries. When medically necessary, a caesarean section can effectively prevent maternal and newborn mortality. Two new studies show that when caesarean section rates rise towards 10% across a population, the number of maternal and newborn deaths decreases. When the rate goes above 10%, there is no evidence that mortality rates improve”. Using this benchmark it is clear that private facilities are resorting to caesarean deliveries for unethical commercial reasons and not based on medical needs. On the other hand, the very low rates of caesarean deliveries in the public sector in some states – Bihar, Haryana and MP – point to poor capacity in public health facilities.
Tripura outshines the big states
While the data from Tripura has not been discussed in the earlier analysis, it is worth mentioning that the state’s progress has been remarkable in many areas when compared to even the better performing states. The decline in child mortality in Tripura, from 104.6 in 1992 to 33 in 2015 is the steepest among all the states studied. Decline in child malnutrition levels (from 39.6 to 24.1) has also been the steepest and its rate of 24.1% is only marginally worse than the best performing state (in the sample studied) of Tamilnadu. Further, Tripura’s child sex ratio -- at 966 – is better than that of any of the large states studied.
Is the government listening?
While we await more details from NFHS 4, even the limited data available shows a mirror to all that we are doing wrong while implementing healthcare and social protection policies. While there are major regional variations, we are clearly not doing enough and in some cases we are sliding back. It is relatively easy to gather data, the harder part is to draw appropriate lessons and inform policy based on an analysis of data. The present government, high on rhetoric and abysmally poor in deliver, clearly has its work cut out.
Disclaimer: The views expressed here are the author's personal views, and do not necessarily represent the views of Newsclick
Get the latest reports & analysis with people's perspective on Protests, movements & deep analytical videos, discussions of the current affairs in your Telegram app. Subscribe to NewsClick's Telegram channel & get Real-Time updates on stories, as they get published on our website.