The Stupidity of Government's Poverty Estimates
The UPA government has recently declared that anyone earning over Rs 27 in rural India and Rs 33 in urban India is to be considered as living above the poverty line. The Congress party leaders have taken a step further and commented that one could easily get a meal for Rs 5, Rs 12 etc. Newsclick discusses these figures and their economic implications with Dr. Smitha Gupta, Economist at the Institute of Human Development.
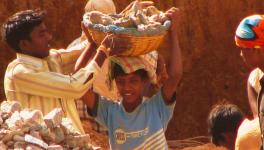
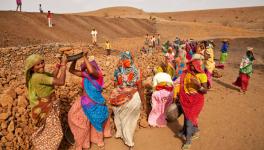
Image Courtesy: flickr.com
Transcript:
Rishab Bailey (RB): Hello and welcome to Newsclick. The government recently declared that anyone earning over Rupees Twenty Seven in rural India and over Rupees Thirty Three in urban India was to be considered as living above the poverty line. Various politicians have taken a step further and suggested that it is perfectly easy to get a meal for as little as Rupees Five or Rupees Twelve. To discuss what these figures mean and their economic impact, we have with us today Dr. Smita Gupta, economist at the Institute of Human Development. Hi Smita and thanks for joining us today. Now, the official poverty rates used household expenditure as a measure of how rich or poor a family is. I understand that this survey primarily accounts for calorie consumption adjusted for inflation over time. Do you believe that this a good or economically sound method of measurement given in particular the fact that household expenditure may not adequately mirror the consumption of food and also the absence of human development indicators in this index?
Smita Gupta (SG): I think prior to asking whether this is a good or a bad indicator, let's understand what the indicator is because there is a lot of obfuscation that goes on. In 1973, the Planning Commission accepted a methodology based on the twin criteria, separately for rural and urban areas of calorie intake where they said that 2400 calories per person in rural areas and 2100 calories per person in urban areas is what is required to keep a person out of poverty. Therefore, they looked at the consumption expenditure and consumption patterns. By pattern I mean the basket of commodities that is consumed per household. In the NSS data, to see at what level of income can households, after they meet their non-food requirements, actually meet this food consumption requirement. Now, the non-food requirement, as you know, would include manufactured goods, utilities, rent, health, education and so on. So in 1973, they actually found that it was rupees fifty six for urban areas and forty nine for rural areas. At that time, the poverty line was based entirely on the calorie content of this line and the definition was the level of income at which a person can consume more than 2400 calories in rural and 2100 in urban areas. After that, all that they did was use price index to upgrade this line. So, after that, there was no reference to standard of living. The question asked was not that, at what level of expenditure will the same standard of living be maintained to stay out of poverty. The question really was what is rupees fifty six of 1973 equal to today. So it was just an indexation of the 1973 line. This has three problems. One is that the basket of commodities is assumed to be the same now too, which is you know, forty years hence. So the problem is number one, the basket of commodities has changed and this does not capture that and secondly all our incomes have increased far more than the price index, for example as Utsa Patnaik argues, one thousand rupees then is equal to eighteen thousand rupees now, using only the price index. One thousand rupees is what a senior government official was getting then, but they are not getting eighteen thousand today. They are getting seventy thousand today at the same level. So therefore, clearly the basket of commodities has changed, the standard of living has changed, but to maintain the same standard of living, there are many other factors which come into play.
RB: Now, what is this poverty line statistic actually used for? I mean, there is some confusion over whether this statistic actually effects the number of beneficiaries under central government schemes and so on. Do you believe the government is actually guilty of using double standards, I mean, on one hand saying that these statistics are used purely to measure trends, but on the other hand actually using it to work out subsidy allocations and so on.
SG: See, I wish the whole discussion was purely an academic one about you know what has been the trend overtime in the certain number. It isn't. It has very very important implications for peoples well-being because it means that your access to so many government schemes, welfare programme would depend on whether you are poor or non-poor. So, when the government fixes the number, then, only that many people will have access. But the government itself is not very convinced by it's own 22% estimate. Why else would they have a food security bill with 67%? So the government itself knows it is wrong. So they do double-speak. At one point they say - no no, this is purely an academic exercise with no implications for policy. On the other hand, so many schemes of the government depend on your having the BPL card or not. To this, I want to add another dimension to this whole discussion, which you raised earlier, the question of Human Development. See why is there this outrage when you look at this number. Number one, because it is so low. I mean, 33 rupees and 27 rupees is laughable. But the outrage is also because it is so unbelievable that we have reduced poverty, we have pulled out a 138 million people from poverty in the seven year period. That's what they are saying. They are saying 138 million people have been pulled out of poverty in seven years and much of this in the last two years alone. So the rate of decline have been at an average of 2.2 % per year. And yet, look at other things. For example, you look at anaemia. Anaemic children continue to be at 75%, women at 50%, low birth rate babies at about 30%, chronic energy deficiency at about 1/3rd of the Indian population and so on. So therefore, the whole idea that poverty is coming down at a time when every other indicator of well-being, of health or nutrition is doing so badly. It itself is unbelievable.
RB: Which actually leads me, you know, to my next question. Isn't there a recognised global standard to judge what is or what constitutes poor or poverty? I mean, I understand for instance, at the World Bank they use an extreme poverty line of a dollar 125 which is adjusted for purchasing power parity. On what is this based and why it isn't used the world over or similar standards.
SG: You know, at a dollar twenty five or even a dollar, where are we, 62 rupees. You know then, 62 rupees is what about 10 % of our population spends. So in the Indian case, if you use an estimate like that, then of course we have mass poverty. But that's not the point. I think every state, forget about every country, has it's own specificities, it has it's own prices, it has it's own consumption patterns so I am not really a great votary of having a universal poverty line across the globe or even across the country. So, I mean, you can for the sake of a debate. For the sake of a comparison, you can do that. But that's not something which I think is the path to go. I think the path to go is actually to ensure that food and nutrition remains a central part of any definition of poverty and add to that, non-food expenditure, for example health, education, shelter, transport, utilities like power etc., sanitation, water. So, if you have a basket of this kind and then you can give it a number. It is not difficult to do. Let me just tell you that in the NSS data itself, you can actually read, at what level of monthly per capita expenditure do you have your 2100 and 2400 calories. You can actually read it. And, if you read it, for example for 2004-05, you find that something like 70% of rural households and 65% of urban households were not getting the minimum calorie requirement. Now you come to 2009-10, it actually worsened and you found that 75% of rural households and 73% of urban households were not getting their minimum calorie requirement. So, you actually don't need to spend too much time to devise, it is good to devise a better indicator, but even the existing 1973 definition of the Planning Commission itself, if they use it with the existing database, they can actually arrive at a poverty line but they dont want to do that because then they cant show that the UPA government has brought down this.
RB: The government has announced that poverty in India has declined tremendously from 37% in 2005 to 22 % last year or the year before. Now, you clearly dont agree with this assessment based on what you have just said. Could you just explain further, why you think the current methodology produces or does not produce a realistic portrayal of poverty in India, other than the fact that its fairly simplistic.
SG: Well, the reason as I said earlier is that there is no direct reading of people's consumption patterns. I mean, you can see in the data, at what level of expenditure, for different deciles of the population, whether you want to do income distribution or whether you want to do it on the basis of land distribution or any criterion that you use, and you can use expenditure criteria themselves, so the bottom 10 % in expenditure, the next 10 %, the next 10 %, you take 10 deciles, for each decile you can actually read at what level of expenditure do they meet or do they not meet their calorie requirement. So, its not difficult at all.
RB: Why do you believe, if you were to go by the government's figures at least, there's been a huge change in poverty statistics and now, why do you think, I mean if you were to believe their figures, this has happened. Is this just tinkering with the indicators, is this because of social schemes like NREGA, or is this actually an effect of the booming Indian economy in the late 90s and early 2000 trickling down to the masses?
SG: Actually what has happened? What has happened is that the monthly per capita expenditure across deciles has gone up. This is being used as the basis for arguing that poverty has come down. But, why has expenditure come down and does that give us cause to us to celebrate? It would, had people's standard of living improved. But what do we find? What has happened in the same period. There's been a very high food price inflation; there's been a declining trend in employment growth. In this very period, you find that all utilities and public services are getting increasingly privatised and becoming more costly and out of reach. So, therefore, the non-food component of expenditure of households has become quite significant in terms of its burden on the household budget. And so, while the government is correct in saying that the monthly per capita expenditure has grown, from this to deduce that standard of living has improved or poverty has come down, is erroneous.
RB: As you mentioned, there are many indicators in which India is doing badly, human development indicators, in particular. How do you square these positions, given the fact that you have an increase in national consumption or in spending patterns. How do you square the fact that you have a set of people in India who are getting richer and richer but at the same time it appears that these benefits are not actually reaching the vast majority of people in rural India?
SG: You know, there is a deep polarisation. When the monthly per capita expenditure of the poor goes up, it is absorbed in higher costs for the same thing. So, they consume less and less. It is not higher consumption. It is higher expenditure but lower consumption, greater deprivation and a far lower standard of living. That's what is happening for the poor. It's only at the upper end because of, as you said, rising inequality, that higher consumption in terms of higher goods being consumed that takes place. So, at the lower end you have prices and higher costs which absorb much of the high expenditure which the poor are incurring. So, you have this dichotomy of growing expenditure and worsening standard of living, higher deprivation, greater malnutrition, worsening health statistics.
RB: Even though states are free to set their own measures of poverty, very few have actually done so. Kerala is an obvious example. Why is this? Why are state governments so eager to just use whatever data the central government is giving them?
SG: To put it in another way, what you are asking me is why are centrally determined poverty estimates so sticky? Right? Now, the reason that happens is because much of the centrally funded schemes and the centrally funded programmes are allocated by the Planning Commission and by the different ministries on the basis of need and need is determined by poverty. So, when you target public programmes, when you target government schemes, then clearly those states, the states will only get their money in proportion to their poor and any further expenditure that they want to do, which they are doing, Tamilnadu, look at Taminadu's near universal food security scheme, for example, they are doing it. But the allocations from the centre are done on the basis of the centrally determined poverty estimates. And so for the states to have their own poverty estimates, doesn’t make any sense from the point of view of central allocation. But the states have been demanding for long, that let us identify the poor and let us have the criterion and let us tell you, that in our state we have so many poor, but they dont allow it at the central level. They say - no; we will tell you that you have 10 % poor.
RB: Given that, it appears anyway that the government's bluff has been called on these figures that they have announced, why do you think they actually came up and announced these figures with so much fanfare? In particular, given in urnab areas you have rising inflation and at the same time you have Rangarajan Committee which is actually looking at reformulating the methodology to calculate the poverty lines. What was the hurry, is it because we have elections in a year?
SG: Well, you know, its interesting for you to know that since 1970, the large sample has been done by NSS every 5 years. This is for the first time that within 2 years they had another very large sample. Why? Because they wanted to ensure that the 2004-5 period upto the 2010-11 period was coterminous with the tenure of the UPA government. Its no surprise, therefore, that you have this massive, unprecedented poverty reduction in this period. 15.3 percentage points. So the whole idea of doing this large round was in any case to tom-tom the achievements of the government and the reason why they jumped the gun and did not wait for Rangarajan Committee because that would come in 2014, election year. So the whole political benefit which they think they will get from trying to say that there was 2.2 reduction per annum in the UPA regime of poverty, they will not be able to get after 2014. So that's the undue haste with which they brought it out. That explains that. And the reason why they did another large round, is again the same. They dont want to wait. Because the next large round is again in 2014-15. So that doesn't help them.
RB: Thank you Smita for being with us today.
SG: Thank you.
Get the latest reports & analysis with people's perspective on Protests, movements & deep analytical videos, discussions of the current affairs in your Telegram app. Subscribe to NewsClick's Telegram channel & get Real-Time updates on stories, as they get published on our website.