Why EC Owes an Answer to the Country Over ‘Phantom Votes’
Following the recently concluded Lok Sabha elections, most political parties have been scrutinising the data released by Election Commission of India (ECI), and have substantial reasons to do so. It has been revealed that the total difference between the votes polled during the seven-phase election and the votes counted on May 23 stands at a whopping 5.465 million, as per the data available with the ECI itself. Such a vast difference cannot be dismissed by means of ‘disclaimers’ that say that these are only ‘provisional numbers’. Because the winners of this election – which was swept by the Bharatiya Janata Party (BJP) – were announced on the basis of these very provisional numbers.
The role of the Election Commission – which was criticised time and again for going soft on the ruling BJP in spite of several violations of the Model Code of Conduct by its leaders during pre-poll campaigning – comes under scanner once again with the hue and cry surrounding these ‘phantom votes’.
A few parties are said to have collated Form 17C from booth level to crosscheck the veracity of the data released by the ECI. The reasons are said to be many; like mass movements of reserved EVMs day(s) after elections and ECI’s vague and casual response to such EVM movements. Against this backdrop, it will be interesting to take a look at the data published by ECI and understand why these ‘phantom votes’ should be a cause of concern.
We have four sets of data here. The first one is from ECI Voter Turnout Mobile application. In the notification ECI put out while launching this app, they have clearly mentioned: “The mechanism involves simple entry of estimated cumulative percentage turnout through the web or mobile app during the currency of the poll. These entries are to be done mandatorily on a designated time slot by the Assistant Returning Officers from within the New Suvidha Portal. After the end of the poll, New Suvidha Portal allows entry of detailed turnout report both Lok Sabha and Assembly Election-wise, which includes Male, Female, Others gender numbers against the total number of electors.”
This is very important because ECI says it is “estimated cumulative percentage turnout” (emphasis added). In the same breath, ECI, in its notification in para 3.2, says: “3.2 The entry into the module is mandatory by each ARO on every two hourly intervals. The following will be the slot available for data entry 1. 9 AM, 2. 11 AM, 3. 1 PM, 4. 3 PM, 5. 5 PM, 6. END OF POLL.”
In Para 3.5 EC says: “If the entry is missed based upon the above schedule, no entry will be allowed on that missed time slot. However, the next entry can be made. As the numbers entered are cumulative, the missed entry will not affect the total turnout. After the 3 PM report time slot is over, CLOSE OF POLL button will be enabled. Anytime after 3 PM the ARO can close the poll by entering the estimated turnout %. The remaining time slot i.e. 5 PM entry will be disabled if the CLOSE OF POLL is enabled. However, ARO can de-freeze the CLOSE OF POLL and the entry for 5 PM will again be available for entry. The CLOSE OF POLL percent entry is never timeout and therefore, the entry can be edited anytime afterwards.”
The fact is that even though the ECI put out certain caveats to make its life easier later, they have captured almost clear percentage of turnout data in the app itself. We can safely reach this assumption by comparing the voter turnout data put out by ECI after every phase of polls and updated on May 24 – a day after the results were announced. In comparison, except in the final phase, the updated voter turnout percentage on the ECI’s website and the one published in the Voter Turnout app stand almost the same with very minute variations, which we shall check later. Let us see it in a graphic chart to understand it better. Don’t forget, these numbers in the ECI app were released on that particular voting day by late night and the ECI website last updated the data on 22 May – a day before counting of votes. Here too, at the bottom of the files, ECI has written in bold letters: ‘*Note: Provisional Data: subject to change till the generation of Index Card.’
For a minute, let us accept that both these sets of data are not final, but are only provisional. The most intriguing piece of information comes from this part of the ECI website. This was last updated at 08:10:02 PM on May 24, 2019 – a day after election results were announced. It has the candidate-wise votes polled for all the 542 constituencies including NOTA and postal ballots. Election results are declared based on these numbers. But ECI has put a “disclaimer” here too! It reads: “The trends displayed are based on the data entry done by ARO/RO as when they complete these rounds and is subject to change. Only Result signed and declared by Returning officer has the statutory validity.”
Let us agree with what the ECI says. But that raises a pertinent question: what should be the permissible variation between three sets of same data – especially that of an election in a democracy? As of now, we don’t know. If such variation is of a few million votes, how can ECI justify that as the fault of “provisional data”?
Also watch: Elections 2019: How Neutral is Election Commission?
As per the ECI website, India had 910,139,031 eligible voters ahead of the 2019 general election. The election happened in seven phases. As per the ECI website, 141,788,110 were eligible to vote in the first phase and out of that, 69.58% or 98,650,308 people voted. The graphic chart below explains it in a simple way.
Till the sixth phase, there is no mismatch between the “estimated” numbers in the ECI app and the “provisional data” of the ECI. But it changes in a big way when it comes to the seventh phase. In the 59 constituencies which went in to polls in the seventh phase, as per ECI, there were 101,378,531 eligible voters. The ECI app shows that the “Estimated Voter Turnout” after three and a half hours of the end of election on May 19 was 63.98%, meaning 64,861,984 people had voted.
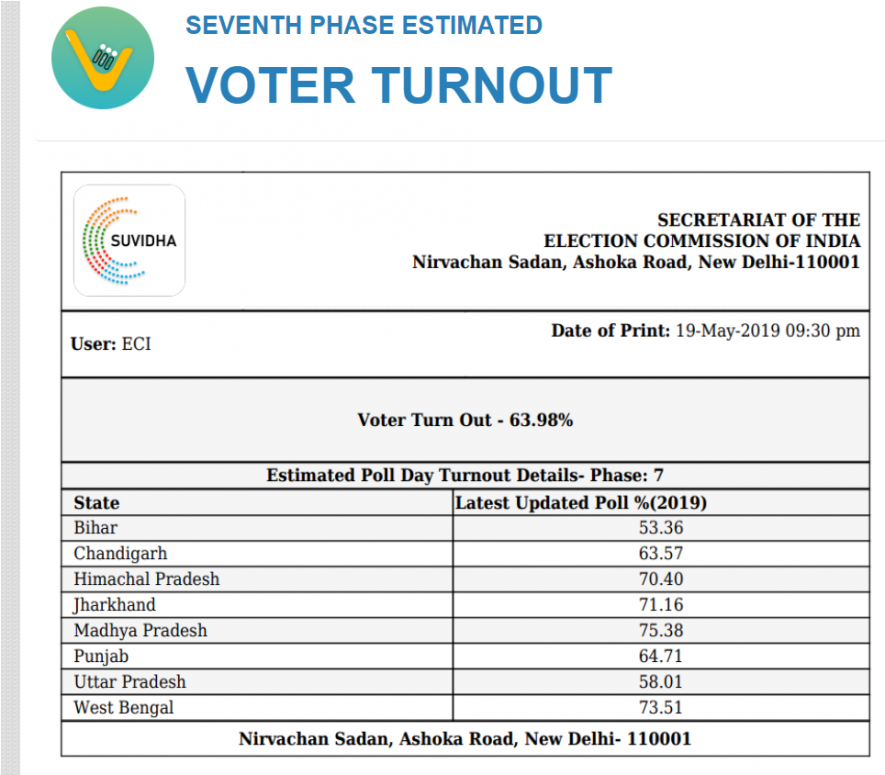
The (provisional) numbers for seventh phase updated on the ECI Website on May 22 shows that the voter turnout was 61.71%. It means 62,560,691 voters used their franchise on May 19. Here, the difference becomes vast – of 23,01,293 votes!
ECI app has revised the numbers a few times in between. On May 28, it showed 65.16% turnout in the seventh phase, and on May 30, the “estimated voter turnout” in the app stood at 65.07%. The difference between 61.71% and 65.07% comes to 34,06,319 votes! How on earth does the provisional data vary by 3.406 million votes in a single phase of election out of seven phases?
Now let us look at the other set of data which the ECI has put out on its website. Here, one can check the total number of votes polled – both on the EVMs and the postal ballots – for all the candidates in all the 542 constituencies where elections were held. As per the data uploaded on this website, the difference between the number of votes counted and votes polled is quite vast.
Let us look at the graphical representation of these numbers:
The ECI has again written a disclaimer, saying: “The trends displayed are based on the data entry done by ARO/RO as when they complete these rounds and is subject to change. Only Result signed and declared by Returning officer has the statutory validity.” But this disclaimer raises a fundamental question: how can the ECI change the data even by one vote once the results are already announced?
In the first phase of election, 91 constituencies went on to polls with a total of 141,788,110 eligible voters. Out of the total, ECI data says that 98,650,308 people voted. However, the total number of votes counted were 99,205,334 comprising 98,680,286 EVM votes and 525,048 postal ballots. That amounts to the difference of 555,026 votes.
In the second phase, 108,221,442 votes were polled. The total number of votes counted were 109,063,176 including 109,063,176 EVM votes and 417,151 postal ballots. Here, the difference is of 841,734 votes.
| Phase | Seats | Polled Votes | Counted Votes | Difference |
| PH 1 | 91 | 98650308 | 99205334 | 555026 |
| PH 2 | 95 | 108221442 | 109063176 | 841734 |
| PH 3 | 117 | 129164277 | 129401727 | 237450 |
| PH 4 | 72 | 83970574 | 84313251 | 342677 |
| PH 5 | 49 | 56334850 | 56434227 | 99377 |
| PH 6 | 59 | 68460969 | 68678749 | 217780 |
| PH 7 | 59 | 62558995 | 66099525 | 3540530 |
| Total | 542 | 607361415 | 613195989 | 5834574 |
This data includes rejected votes. Normally, a certain percentage of postal ballots get rejected for various reasons, and that numbers are put out by the state election commission in the Form 20 of every constituency. As of now, most of the chief election officers’ websites are yet to publish this data. Bihar has released it, which can be checked here. So, to calculate the average percentage of rejection, we have calculated the cumulative average from 40 constituencies of Bihar.
In Bihar, a total 162,839 postal ballots were counted and out of these, 23,792 votes were rejected. So, let us, for the sake of extrapolation, suppose that the average rejection rate was 14.61%. Now, let us calculate the rejected votes for the entire country.
The total number of 1,846,431 postal ballots were counted across 542 constituencies in 2019 general elections. We have seen, in a state like Bihar, that the rejection rate was 14.61%. Let us be more generous and presume it would be about 20% for the pan-nation calculation, which would mean that 369,286 postal ballots were rejected. If we reduce this number from the total counted votes, we still have 54,65,288 more votes than polled. That is 0.9% more than the total votes polled!
These figures are capable of raising serious doubts in the minds of the voters, especially when this election has awarded a thumping majority to the BJP, despite economic failures in its five-year tenure. In order to ensure that the democratic fabric of this country is unruptured, the Election Commission needs to step up and address this issue, and not let this ‘phantom’ haunt the spirit of democracy.
Also read: Thousands of Phantom Votes Suspected Across Lok Sabha Seats in Bihar, UP
Get the latest reports & analysis with people's perspective on Protests, movements & deep analytical videos, discussions of the current affairs in your Telegram app. Subscribe to NewsClick's Telegram channel & get Real-Time updates on stories, as they get published on our website.