New Poverty Numbers – How Real Are They?
The latest report on global poverty is making news because it claims that 271 million people have moved out of poverty in India between 2005-06 and 2015-16. That’s a stunning number. It means that poverty rate has steeply declined from about 55% to 28% in that decade. Of course, this still leaves some 364 million people in poverty in India, the highest number in any country and about a quarter of the world’s 1.34 billion people living in ‘multidimensional’ poverty.
The report was prepared by the Oxford Poverty & Human Development Initiative (OPHI), University of Oxford, and published collaboratively with the United Nations Development Programme (UNDP).
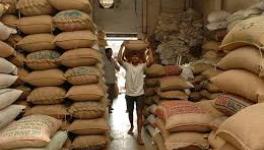
The results seem counter-intuitive. The period mostly saw healthy GDP growth except for the 2007-2008 period of the financial crisis. But it also saw the infamous ‘jobless growth’ with jobs being created at less than 2% per annum. That was a period of unrelenting agrarian crisis, marked by farmers’ suicides. Various official surveys, including Census 2011 and NSSO Surveys recorded growth of marginalisation of work, increase in agricultural labour, decline in cultivators, stagnation in wages of industrial workers, etc. So, how come there is this quantum decline in poverty?
The reason could well be in the way poverty is defined and measured, a problem that Indians know very well. To understand this, one will have to step back a bit and look at how the whole academic field of measuring poverty has evolved. A detailed narration is not possible here but in sum, here is what has been going on.
Income Poverty
The conventional way of measuring poverty was through income or consumption expenditure. The World Bank developed and refined this method, hand in hand with the nostrum that only the really poor should be targeted by government policies. Otherwise, fake poor people might get the reliefs offered by government policies and that would be a waste.
This method worked through defining a poverty line – a minimum income/consumption spend – with people below it classified as poor (BPL – below poverty line, as popularly known in India). India had its own share of definitions of poverty starting with the expert group headed by headed by Y K Alagh in 1979, then another one led by D T Lakdawala in 1993, then the Tendulkar formula in 2005, which was used by the Planning Commission till 2011-12 and updated subsequently. Following countrywide outrage at the Tendulkar-based recommendation of just Rs.22 per day as the poverty line in rural areas, the Rangarajan committee was set up to devise a new formula. It recommended Rs 32 in rural areas and Rs 47 in urban areas and estimated that 363 million people were BPL in 2015, making up 29.5% of the population.
Meanwhile, the World Bank and others were using similar methods and recommended a global poverty line of $1.90 per day calculated on the basis of purchasing power parity (PPP), which is a method of making expenditures in different countries comparable.
‘Multidimensional Poverty’
Now, all this number crunching on poverty led to some very valid criticism globally, the crux of which was that poverty is not just lack of cash. A family can suffer from deprivations of other kinds like: lack of schools for children, lack of basic healthcare, lack of safe drinking water or sanitation, etc. Such deprivations are not measured by the income method. Hence a move was made to develop an alternative measure of poverty that considered such issues rather than income or consumption spend.
Thus, a new definition of poverty called ‘multidimensional poverty’ and a new method of measuring were developed, led by the OPHI. A single number or index called the multidimensional poverty index (MPI)was defined through a mathematical exercise to represent this new concept of poverty. The first of these assessments was published in 2010.
The latest numbers released on September 22, 2018 are of this MPI. It considers three ‘dimensions’ of deprivation – health, education and living standards. Various markers are considered for each dimension: for health - nutrition and child mortality; for education – years of schooling and school attendance; and for living standards – cooking fuel, sanitation (toilets), drinking water, electricity, housing, assets. Each dimension is given a weight of 1/3. Within each dimension, each of the markers (like nutrition or schooling) is given equal sub-weight.
What is the source of this data? This time, the MPI authors have changed their methodology to make it more robust by using one single survey carried out in the country which covered all these markers or aspects. Such a single survey in India was the National Family & Health Survey, done in 2005-06 and 2015-16. Hence for India, a comparison between the two showed the changes in these markers straight away.
Flawed Methodology of MPI
All this sounds fine, but there is a flaw. The MPI does not take into account income or consumption spending at all. It has gone to the other extreme from the initial World Bank type of calculations which used only income/consumption spend data. The implication of this is very vividly brought out by the example of Sylhet region in Bangladesh quoted in the MPI report itself.
As per the MPI report, Sylhet region had the lowest MPI in Bangladesh with a staggering 62% of the population suffering from multidimensional poverty. But according to the Bangladesh Household Income and Expenditure Survey of 2010, Sylhet was the least poor regions with 28% poor which further dipped to just 16.2% in 2016! How can there be such an enormous difference in the two poverty measures?
The explanation is that Sylhet region has sent a large number of international migrants who send an average of $4,282 per year per household, second only to Dhaka. Also, the rate of increase of remittances was the highest in Sylhet at 76% between 2013 and 2015.
So, what is happening is this: people have relatively good incomes thanks to remittances but schools, healthcare, sanitation, drinking water etc. are not available, forcing the multiple deprivations reflected in MPI.
This brings out the flaw in this exercise: measures of income poverty and other forms of poverty have become mutually exclusive. Both give one side of the picture. In India, propelled by various factors, including government policy, education has spread, child mortality has fallen toilets are more in use, and so on. Hence the rise in number of people that are no longer suffering these deprivations. But, the same people are still facing unemployment or under-employment, low incomes, low female work participation, etc. These latter aspects are not reflected in the conventional poverty counts because of its own specific shortcomings.
Another flaw in the MPI is that it is lumping together 10 different markers and assigning arbitrary weights to each in order to fulfil the desire for one number or index. It puts death of a child due to disease and lack of brick walls and water from a well on par. This is highly problematic.
In sum, it is not really the case that 271 million people have been lifted out of poverty in a decade. That would be so if their incomes too had risen to some acceptable levels.
Get the latest reports & analysis with people's perspective on Protests, movements & deep analytical videos, discussions of the current affairs in your Telegram app. Subscribe to NewsClick's Telegram channel & get Real-Time updates on stories, as they get published on our website.