Is Decline in Multidimensional Poverty in India Real?

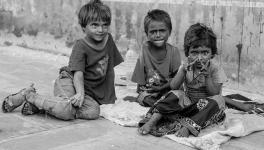
Image credit: The Leaflet
In National Multidimensional Poverty Index— A Progress Review 2023, released on July 18, 2023, the NITI Aayog has reported that multidimensional poverty in India has declined sharply between 2015–16 (when it was 24.85%) and 2019–21 (when it was 14.96%).
Even more heartening is the fact that multidimensional poverty has declined the most in the poorer states of Uttar Pradesh, Madhya Pradesh and Bihar.
In total, 135 million people have escaped multidimensional poverty in the last five years, according to the report.
With this, India is well on the road to achieving Sustainable Development Goals 1.2: “By 2030, reduce at least by half the proportion of men, women and children of all ages living in poverty in all its dimensions according to national definitions.”
Surprisingly, rural poverty has fallen rapidly during the period, even though 2020–21 was the year of the pandemic when the poor suffered grievously and migrated back to the rural hinterland from where they had come to urban India in search of better lives and livelihood.
Multidimensional Poverty Index
The exercise is based on estimating the multidimensional poverty index, based on three broad dimensions— health, education and living standard. Each of them is given equal weight. These three are sub-divided into 12 indicators— three from health, two from education and seven from standard of living.
The Alkire-Foster methodology is used to identify multidimensional poverty, based on the use of a dual cut-off.
First, for each of the indicators, deprived individuals in a sample are identified. Using the weights for each of the indicators, an aggregate deprivation score is derived for each individual. By using another cut off (33.3%) the multidimensional poverty is identified.
Change in multidimensional poverty is then obtained by comparing the data from the fifth National Family Health Survey (NHFS5) (2019–21) with data from NHFS4 (2015–16).
NHFS5 is based on two surveys over two years. This is odd because 2020–21 was an abnormal year due to the pandemic. The NITI Aayog report mentions that 70% of the data was collected in the earlier year, 2019–20, just before the pandemic.
If that was the case, the data from 2019–20 could have been compared with that from 2015–16. Why mix it up with an abnormal year in which much of the data collection suffered?
An average over two vastly different years makes little sense. The data from 2019–20 is not enough to represent the pandemic and lockdown year of 2020–21. It cannot even represent the ensuing years, especially 2021–22, since the shock to the economy due to the pandemic still persisted.
Officially, the GDP recovered to the pre-pandemic level of 2019–20 (4.8%) only in 2022–23.
Thus, three years of growth were lost and the economy was about 10% below where it could have been in 2022–23 if the pandemic had not struck.
Finally, it is the organised sector that recovered while the unorganised sector, where the poor mostly work, hardly recovered but the data fails to capture this reality.
Condition of the poor during the pandemic in 2020–21
Data for 2020–21 were collected from January 2020 to April 2021. It coincides with the first and the second very severe wave of coronavirus in India. This period corresponds to the mass migration of the poor from urban to rural areas since they lost work and had no income. They could not afford to pay rent or buy food.
Many fell sick and had to incur heavy expenditures for treatment, for which they took loans at onerous interest rates. Many died, as the images of people dying outside hospitals, in ambulances and of bodies floating in rivers signified. Many of these deaths went unrecorded.
Globally, counting the number of deaths due to Covid was a challenge. In India, the problem was acute given the weak system of registering births and deaths, a consequence of the very weak rural and semi-rural health infrastructure.
A large number of small- and micro-businesses closed down during the lockdown, many of them permanently. Those that managed to revive themselves later on became heavily indebted due to the loans they were forced to take from the informal money markets at usurious interest rates.
Closure of such units has meant permanent loss of work and incomes, not only for the workers but also for the proprietors.
Education of children— rich or poor— was disrupted. Schools were closed. Where possible, online classes were conducted. That required access to smartphones and laptops, which meant poorer children could no longer afford education.
The children of those who migrated to rural areas during the pandemic suffered more due to loss of access to their schools.
Also, it is hard for children to constantly sit for long hours in front of small screens to receive instructions. There are enough reports of permanent setbacks to the cognitive skills of children, not just in India, but even in developed nations such as the US.
In brief, during the pandemic year of 2020–21, incomes, employment, education and health parameters for the poor suffered a huge setback.
Under these circumstances, suspicions about the credibility of the data showing such a sharp decline in multidimensional poverty as compared to 2015–2016 are bound to arise.
The situation is almost similar to the incredulous official data showing the highest GDP growth rate of the decade during 2016–17, in which year demonetisation was forced upon us.
Issues with data
Even members of the Economic Advisory Council to the Prime Minister have raised doubts regarding the credibility of data. According to them, the sample used in most of the surveys is incorrect since it is drawn from the dated 2011 census.
The members argue that recent big changes are not being captured by the samples drawn from the 2011 census. However, even if the 2021 census was held in time, that would have been too late for the NHFS survey in 2020–21. NHFS would still have had to depend on the 2011 census. The critical point is that the data collected for 2020–21 cannot be representative, even if the pandemic had not struck.
Why is the government unduly delaying the census?
Yes, 2021 was difficult to conduct a census due to the continuing pandemic, even though preparations for the census had been initiated earlier.
But if elections could be held, the census could also have been conducted in 2022 or 2023, when the pandemic had abated and mobility was restored.
Census is a crucial exercise for better policy making which requires correct data.
Could it be that the government is worried that the adverse impact of the pandemic on the socio-economic parameters of the country would have been revealed by data collection in 2022 or 2023?
Macro data is already under suspicion as the largely unorganised non-agriculture sector (30% of GDP and employing 48% of the workforce) is not independently measured.
The growing organised sector is used as a proxy as it gives an upward bias to the production and income data. This results in an upward bias to the other macro variables— consumption, savings, investment, etc. Such data would show declining poverty but that is not the reality. It only gives the government an excuse to not do what it should do.
Finally, data on individual variables in NHFS5 is not only suspect due to the impact of the pandemic, as argued above, but also on grounds that the official data often does not represent the correct picture.
For instance, electricity and cooking gas may come to a household but electricity supply may be erratic and gas cylinders may not be filled due to their higher cost. Child and adolescent mortality rates may be high not only due to deprivation but also due to several diseases.
A child may formally attend school but not effectively if the teacher is missing or hardly teaches. The Annual Status of Education Report points to a huge learning gap but this also goes uncaptured.
Poverty Line
Due to the absence of a consumption survey after 2012, the government is not measuring poverty properly. As per the World Bank, the current international poverty line is US $2.15 per person per day in purchasing power parity (PPP) terms. This translates to approximately ₹26,500 per family per month. Since it is in PPP terms, it would amount to about ₹9,000 per family per month.
PPP is a measure of the price of specific goods in different countries and is used to compare the absolute purchasing power of the countries’ currencies.
Of the 28 crore workers registered on the e-shram portal, 94% have declared a monthly income below ₹10,000. This tells us that most of the unorganised sector workers are close to the poverty line.
Unfortunately, measuring things in PPP terms is a double whammy for the poor. Because their services are cheap, the rupee has greater purchasing power. But since they do not consume most of the services they provide; they do not benefit from the higher purchasing power.
Thus, for the poor, not only are PPP terms not relevant, they mask their true poverty. For them the metric of the ‘nominal dollar’ is more appropriate. Thus, most of the unorganised sector is way below the poverty line.
Nominal dollars (also referred to as actual dollars) represent the actual amount of money spent or earned in a given year.
Conclusion
In brief, the conclusions of the NITI Aayog’s Multidimensional Poverty Report, 2023 need reinterpretation. Apart from the above mentioned lacunae, it is the health and education indicators which have the highest contribution to Multidimensional Poverty Index which were most adversely impacted in the pandemic year 2020–21.
Inaccuracies in NHFS5’s data must have led to substantial errors in the deprivation index based on the survey, opening the conclusions of the NITI Aayog report to suspicion.
Arun Kumar is a Retired Professor of Economics at the Jawaharlal Nehru University. He is the author of `Demonetization and Black Economy’ (2018, Penguin Random House). He blogs at http://arunkumarjnu.blogspot.com/. The views are personal.
Get the latest reports & analysis with people's perspective on Protests, movements & deep analytical videos, discussions of the current affairs in your Telegram app. Subscribe to NewsClick's Telegram channel & get Real-Time updates on stories, as they get published on our website.


